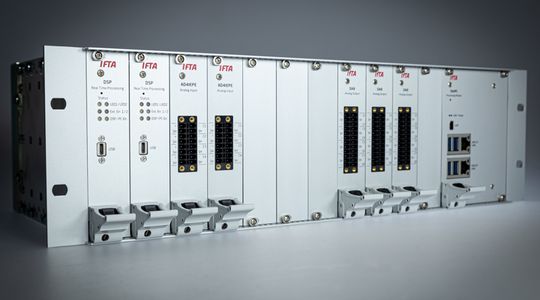
The field-proven monitoring & protection system for stationary long-term use.
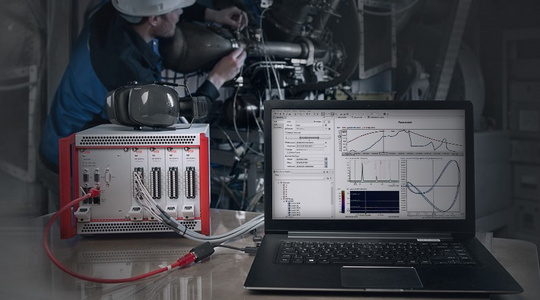
Real-Time Analysis Software
Data generation via IFTA SignalMiner
The DSP (Digital Signal Processor) forms the core of every IFTA system - this is where the real-time analysis software IFTA SignalMiner runs - it is the firmware of the DSP (Digitale Signal Prozessor) Here, dynamic raw data are seamlessly provided with precise time stamps, processed, analyzed, new characteristic values formed and monitored.This ensures the real-time analysis of the data as well as a guaranteed response time and stability as required in protection systems. In contrast to a PC, there is no operating system that could interfere when the user starts programs, other processes or updates.
The communication with the data center, the so-called IFTA DataHub takes place via Ethernet. This is where the IFTA SignalMiner receives its configuration, synchronizes its time and sends the raw data, analysis results and status information back to the IFTA DataHub for storage and online visualization with IFTA TrendViewer. After a power failure, the DSP starts autonomously with the firmware and configuration last stored in its flash memory and resumes its work after a few seconds.

What Does Real-Time Analysis Actually Mean?
Real-time analysis means that between a signal at the sensor and the triggering of an action there is a reliable and specific time span - usually in millisecond range. Ideally, this time span should be as short as possible in order to have the longest possible reaction time. Data is processed immediately after generation. Instead of the term real-time analysis, terms such as real-time data analysis, real-time data integration or real-time intelligence are often used as synonyms. Real-time analysis is essential for a protection system that requires fast response times.
Characteristic Values Calculated in Real-Time
The IFTA SignalMiner is able to calculate and monitor the following characteristic values per channel and for groups of channels in real-time:
- Time values like RMS, PEAK2PEAK, MIN, MAX, DC, ...
- FFT with up to 6400 lines and overlap of 0 %, 50 % and 75 %
- Per channel up to 25 frequency bands with RMS, PEAK amplitude & frequency and histograms and limit monitoring
- Signal quality analysis to eliminate disturbed channels for control tasks
- Combine individual channels into a virtual group channel and envelope spectrum, min/max/average across channels
- Correlation between channel pairs
- Rotational speed analysis (rotational speed, harmonics, SMAX) and rotation angle analysis
- User-defined calculations
- Thermoacoustic PreCursor
- And much more...
These analyses are carried out continuously and synchronously on all time values. The user can freely parameterize on which channel of an output module a calculated characteristic value is issued. Limits and other parameters (frequency band limits, averaging factors, disturbed channels, etc.) can be defined during runtime via input modules without reconfiguration.
Data Acquisition and Analysis: The Basis for Industry 4.0
The acquisition of data and the corresponding analysis form the basis for Industry 4.0. The data that is required depends on the specific application, but the objective remains the same: to collect as much valuable information as possible and evaluate it meaningfully in order to implement improvements in the process.
The better you know your machines, the more optimizations are possible.