What makes the analysis software IFTA TrendViewer stand out in particular can be found here.
Analyze Big Data - Gain Valuable Information
Data Analysis with IFTA software TrendViewer
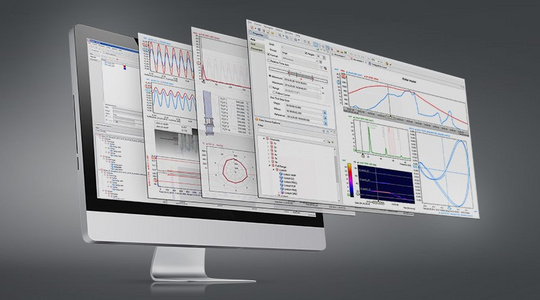
The data analysis software IFTA TrendViewer allows fast and simple analysis of extensive measurement data. It offers a wide range of visualization options and offers a very fast workflow thanks to simple and intuitive drag & drop operation. The display can be adapted to the user's requirements with just a few clicks.
The connection to Matlab extends the versatile, integrated calculation functions and makes TrendViewer a universal visualization and analysis tool for measurement data.
IFTA TrendViewer was awarded the MessTec & Sensor Masters Award 2016 as the most innovative product in the field of measurement technology.
- Analyze large amounts of measurement data by mouse-click (10 GB)
- Generic plot display various visualization options
- Switch between online and offline view - visualize and analyze data during measurement
- Intuitive operation similar to MS Office for quick and effortless familiarization
- Import/Export to MATLAB & ASCII
- Scripting for automatic documentation creation
- Powerful post-processing analysis packages such as FFT, correlations and filters
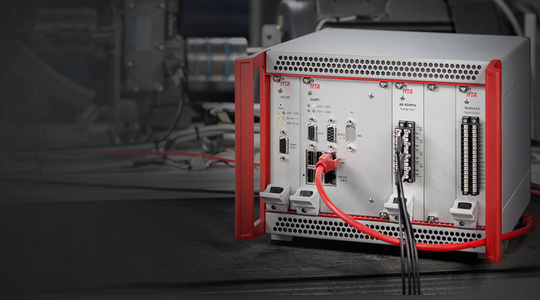
- The measurement systems IFTA DynaGo, DynaMaster, ArgusOMDS and AIC are equipped with the analysis software IFTA TrendViewer. (Customer laptop required)
Time Savings with IFTA TrendViewer
Efficient analysis with several signals
With the analysis software IFTA TrendViewer you can analyze your data quickly and easily. Our software shows its particular strengths when it comes to analyzing several signals at the same time or when you need an overview of large time ranges.
Wherever possible, our software relies on drag & drop operation, e.g. when loading data or adding signals to a plot. Here, all settings are preselected in such a way that a clear plot is drawn immediately - without additional configuration. The user can then further optimize these initial settings quickly and easily - thanks to flat menu structure and intuitive plot property settings.
Especially for the combined analysis of several signals it is often important that all plots represent the same time range and that the scaling of the signals is comparable across several plots. For this purpose TrendViewer offers the possibility to group axes: All axes of a group show the same value range. In this way, time axes or the ordinates of several plots can be synchronized with just one click.
Overview of particularly time-saving features
- Drag & Drop
- Flat menu structures - results with just a few clicks
- Structure is based on MS Office (shortcuts, labels, etc.)
- Editor for document layout
- Synchronous axes & cursors in all plots
- Intuitive setting of plot properties, e.g. zoom level
- Intelligent axis grouping
- Data source explorer with intelligent filtering
IFTA TrendViewer - Analysis Tool for Online, Offline or Big Data
Fast and effective visualization, for...
...online - live-view
Signals and characteristic values, which are generated live by the IFTA system, can be visualized and analyzed online: You can see immediately during the measurement what is happening - without any delay.
...offline - post-processing
IFTA systems record continuously and seamlessly all signals and characteristic values in files. The recorded data can be visualized and analyzed offline - even if located in a different location than the measurement system. In the event of a problem with the machine or plant, you can quickly identify the causes of the problem.
- ...long-term trends - big data
Machines and plants change not only spontaneously, but also gradually over longer periods of time. In order to recognize such trends, enormous amounts of data have to be processed and displayed - this is no problem for IFTA TrendViewer.

Overview Functionalities
Basic Structure
Basic Structure of the Analysis Software IFTA TrendViewer
- Online and offline visualization in a single program
- Easy handling and fast loading times thanks to file-based data management instead of complex and slow database
- Intuitive drag & drop operation
- Fast familiarization thanks to Microsoft Office oriented style, e.g. shortcuts, descriptions, few dialogs, ...
- Individually adaptable, e.g. document layout, plotter settings, user preferences, ...
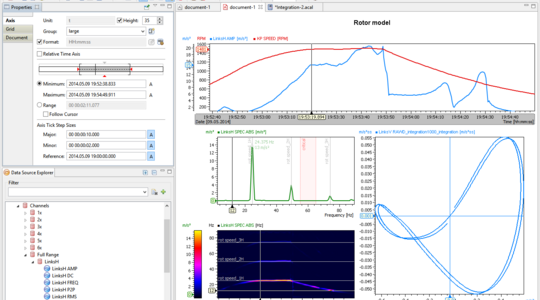
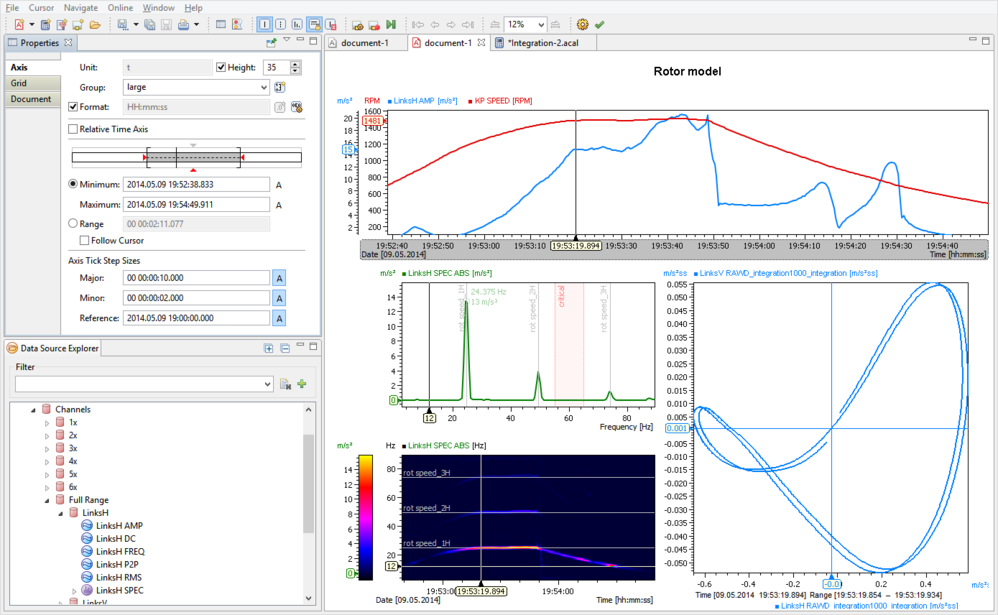
- The editing area is divided into 3 work areas:
1. Top left: Properties - display and change properties of the selected object
2. Bottom left: Data Source Explorer - online and offline data sources
3. Right: Document view in which the user creates plots by drag & drop
Importing/Exporting
Import and Export of Measurement Data
With IFTA TrendViewer, measured values recorded by IFTA measurement systems can be directly and easily displayed and analyzed. Moreover, data can also be imported and exported from other sources:
- Data import/export from Excel, ASCII and MATLAB files
- Data export via the clipboard
- Data export via scripting for automatic report generation in folders/files

Visualizing/Analyzing
Visualization and Analysis of Measurement Data
- IFTA TrendViewer offers a wide range of customizable plots to display measurement data
- Large selection of generic plots with automatic pre-selection to suit the signal type
- Interactive comfortable operation: Zoom, scale, measure, overlay, copy & paste, etc

Comparing
Comparison of Signals and Measured Values
By comparing measured values and resulting signals, you can obtain important information as a basis for troubleshooting and optimization. Do certain machine states and vibrations and interference correlate? Here IFTA TrendViewer offers different tools depending on the application:
- Comparison of different measurement series - the time axis can be switched from an absolute to a relative display and thus enables different test runs to be superimposed and compared in a plot
- Comparison of vibration data and operating data or machine kinematics for machine diagnosis and fault finding: See also Highlight TrendViewer- Adaptive Gridlines
- Correlations and relationships can be displayed using the XY and the Campbell plot
- Display of differently scanned data in one plot

Automatizing
Automation of Work Steps
For repetitive measuring tasks or work steps it can be useful to automate processes. This is easy with document templates.

Presenting
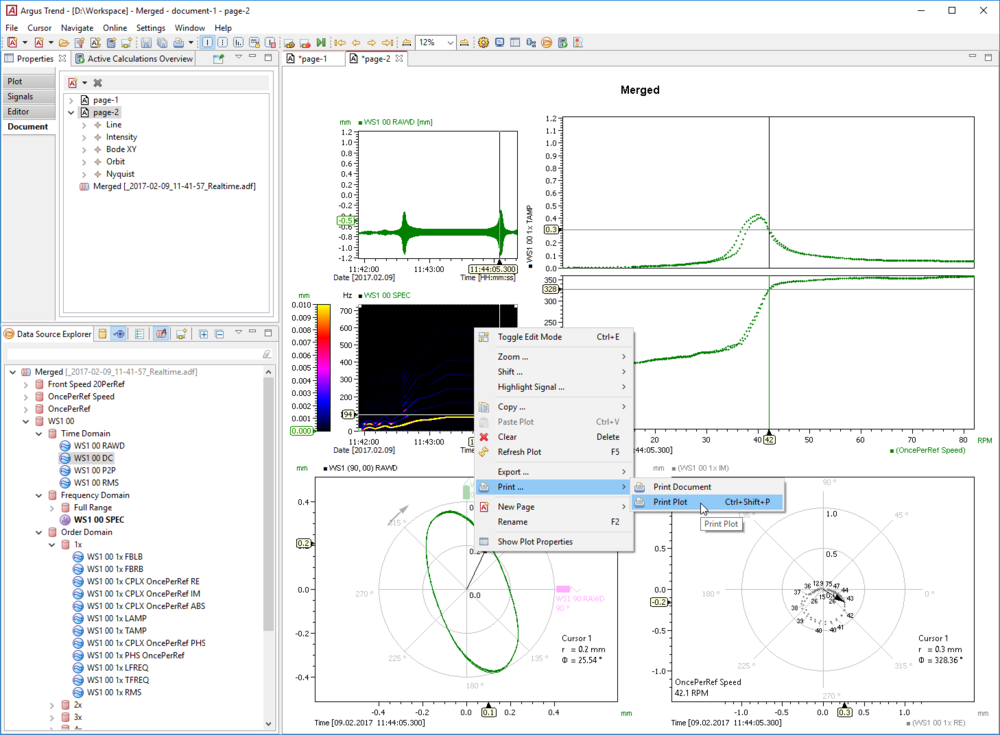
Presentation of Analysis Results
The knowledge and information gathered can be presented best in typical reporting programs such as Word or PowerPoint. Normally, every company already has CI-compliant templates, into which the plots can be copied and pasted. This process can be automated using macros.
Report function is carried out in typical reporting programs, e.g. Word, PowerPoint
- Whole pages or individual plots can be exported and incorporated into the report
Saving
Saving Documents and Document Templates
User-defined visualizations can be saved, including associated calculations and references to the data sources
- When a saved document is opened, all referenced calculations and data sources are restored
- A document can consist of several pages
- Document templates are created simply by saving a document as a template

Loading
Loading Measurement Data
- Whether online from the network or offline from a file, all data sources are displayed in the DataSourceExplorer as a tree structure
- Files are simply dragged and dropped into the DataSourceExplorer or opened by double-clicking in the Windows Explorer
- The ADF filter allows a rule-based search for all relevant time periods in a set of files
- If a measurement extends over several files, these can be automatically combined and analyzed as if they were one file


Plot visualizations
Overview of available plot views for the visualization of measurement data.
Highlights Evaluation Software IFTA TrendViewer


Online-Offline Switch
IFTA TrendViewer Highlight 1
Seamless transition between online and offline view. With just one click, you can switch to the offline view and analyze without disruptive updates while new data is cached in the background. Once you' re done, one more click is enough to switch back to the online view:
- Monitor and analyze anything conspicuous in more detail immediately - even during the measurement
- Direct comparison of offline reference data with current online data
Advantage: All analyses can be done in one program!
- Offline maintenance + development + analysis + troubleshooting
- Online: Test runs + running operation + optimization/machine tuning
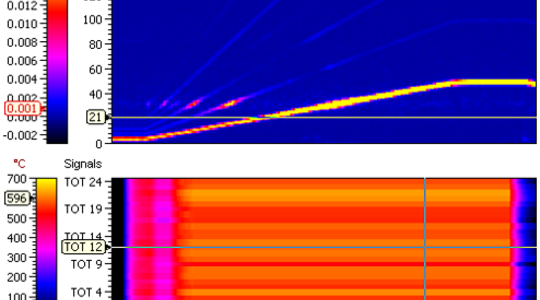
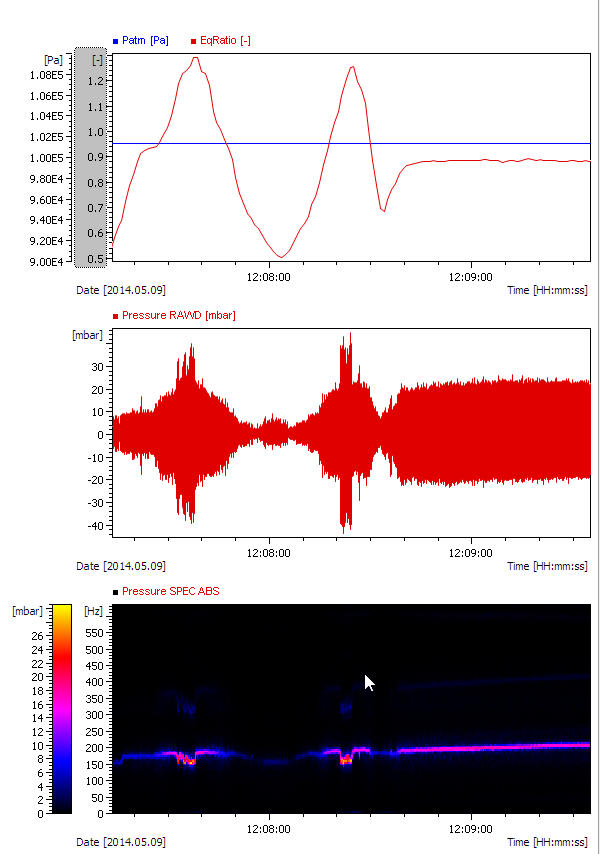
Dynamic & Static Data in One Program
IFTA TrendViewer Highlight 2
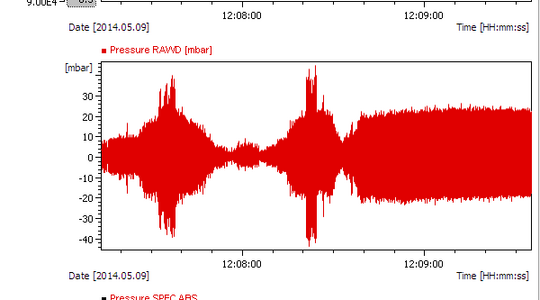
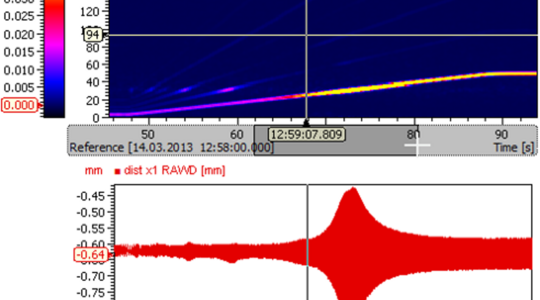
Simultaneous visualization of dynamic measurement data (e.g. raw sensor data) and static operating data/machine data (e.g. speed, power, temperature, etc.).
- Recognize correlations between dynamic and static signals, e.g. fault finding
- Predictive maintenance - e.g. after the machine has been running for many hours, the vibration amplitudes increase and maintenance is due
- Efficiency increase - e.g. calculation of ideal consumption/utilization
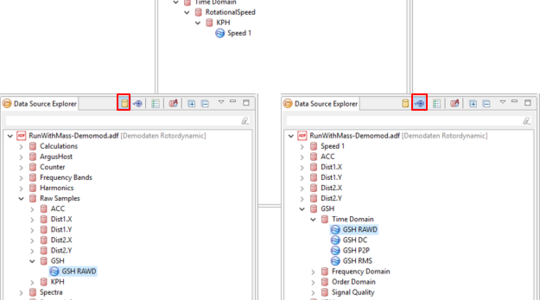
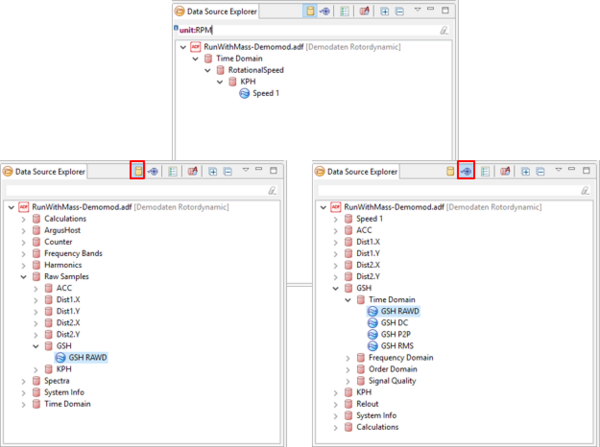
Filter Function for Data Sources
IFTA TrendViewer Highlight 3
- The DataSourceExplorer has a filter to find specific/known signals quickly
- Data aggregation with verification. If multiple files are merged, a warning will appear if they originate from different machines/configurations
- Two views available:
A) Data View: Displays signals grouped by data type
B) Sensor View: Displays signals grouped by sensor
Generic Plots
IFTA TrendViewer Highlight 4
Large selection of generic plots - unlike competitors, no fixation on specialized plots, but free combination and usage options
Advantage: Almost unlimited visualization possibilities
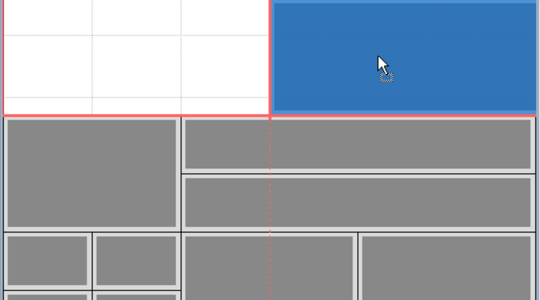
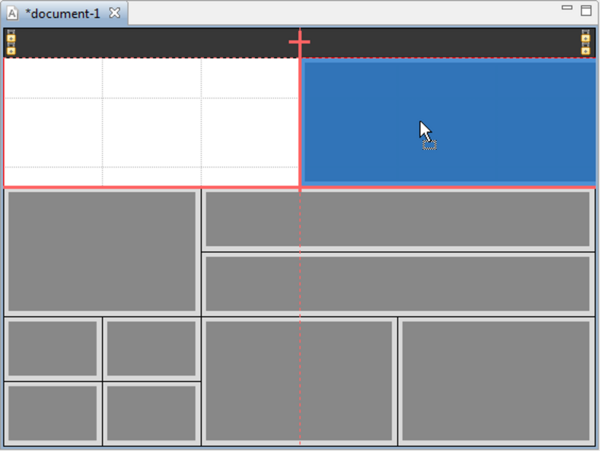
User-defined Plot Layout
IFTA TrendViewer Highlight 5
Document editor to customize the layout and save document templates:
- Easily customize document layout
- Images and text can also be added
- Create document templates by saving documents as templates
- Axes of the plots of a column are automatically aligned to each other
Intelligent Axis Grouping
IFTA TrendViewer Highlight 6
- Intelligent automatic axis grouping - inter plot by unit and measuring range
- All axes in a group have identical settings - changes to an axis affect all axes in the group
- Better overview, error avoidance, convenient and fast operation
- Simple regrouping using keyboard shortcuts or drag & drop
Synchronous Zooming & Scrolling
IFTA TrendViewer Highlight 7
Simultaneous synchronous zooming & scrolling in different plots with grouped axes:
- Convenient, fast and precise analysis
- Avoid errors
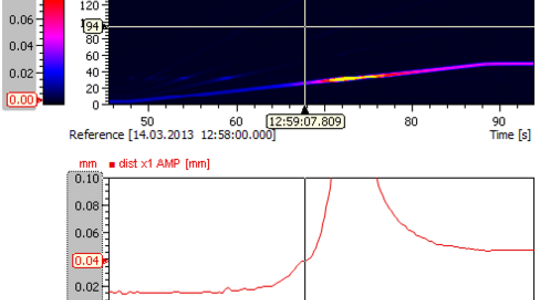
Synchronous Cursors
IFTA TrendViewer Highlight 8
- Synchronous cursors over all plots
- Visualization of the values at the cursor position on the axes and in the list plot
- Quick and easy comparison of signal values in different plots

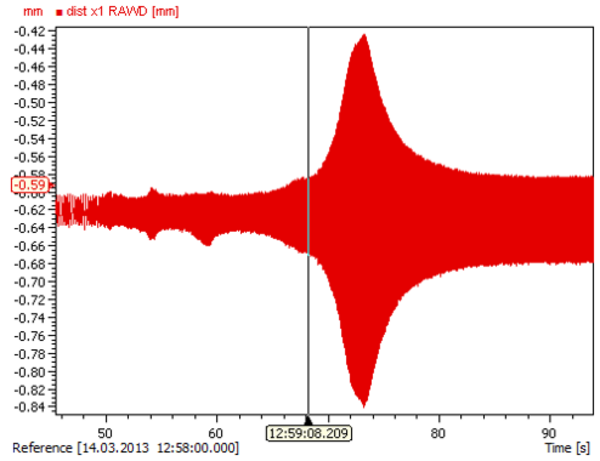
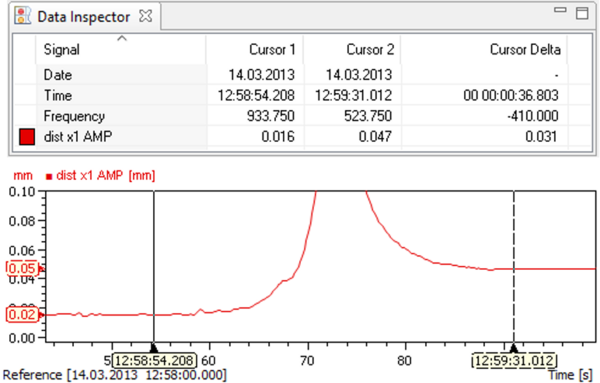
2 Measuring Cursors with Delta Calculation
IFTA TrendViewer Highlight 9
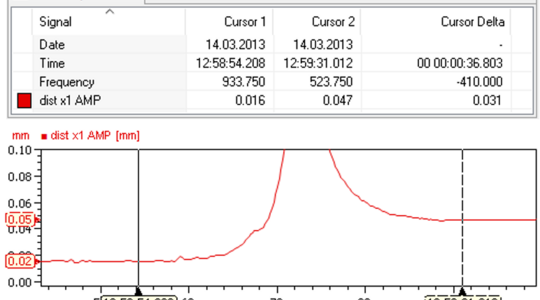
The "Data Inspector" shows clearly all signal values at the current position of the time cursor. If both time cursors are set, it shows the delta between the values at the different times
- Fast determination of signal values
- Fast determination of the change in signal values between two points in time
- Consideration of values and their difference before and after a phenomenon
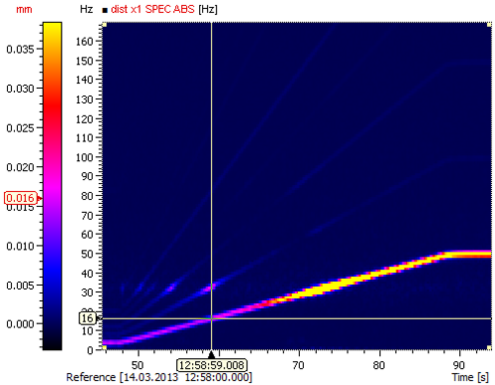
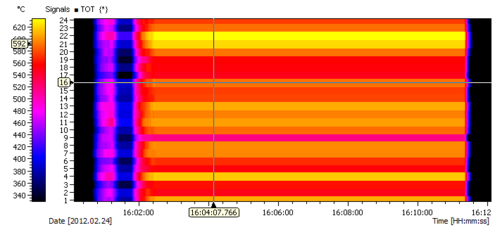
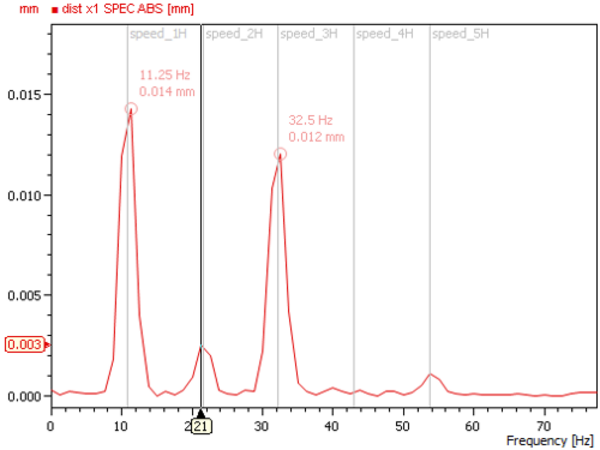
Adaptive Gridlines
IFTA TrendViewer Highlight 10
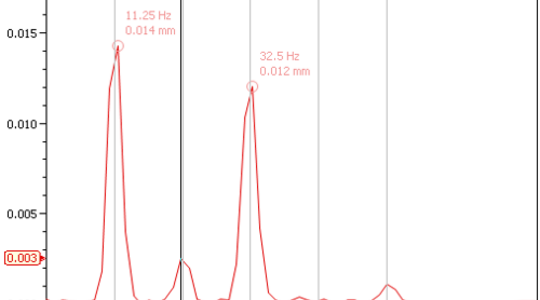
- Set grid lines that are linked to a signal
- This is an important diagnostic tool for damage analysis
- Simple configuration of complex dependencies (harmonics, subharmonics, sidebands, etc.): Complete machine kinematics can be mapped
- Fast identification of specific frequencies in the spectrum
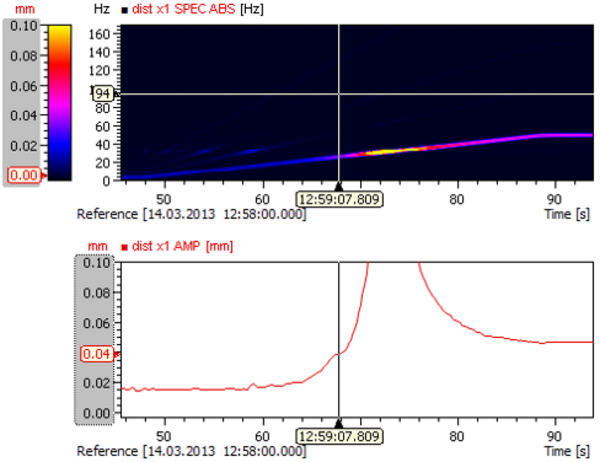
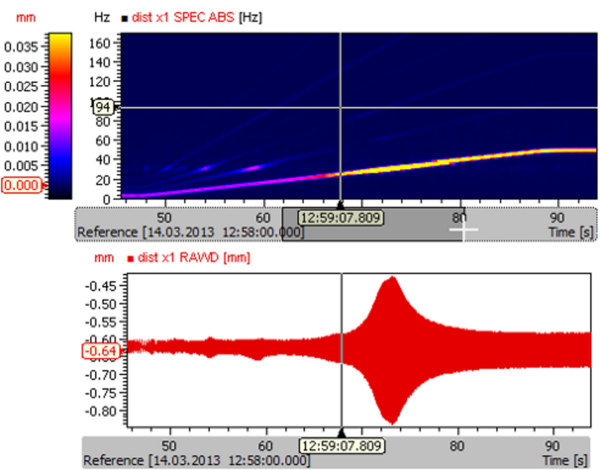
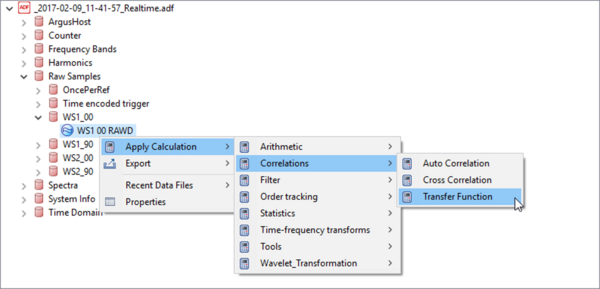
User-defined Calculations
IFTA TrendViewer Highlight 11 (Add on)
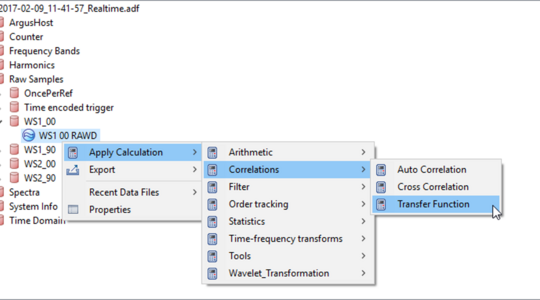
- Library of calculation functions for online and offline signals for advanced analysis and calculation of new characteristic values
- Detailed online help on theory and application
- Calculation Script Editor for advanced users who want to customize calculations or create completely new user-defined calculations
Without further external software, signals can be analyzed with other settings (e.g. higher FFT resolution, different frequency bands, averaging of spectra, etc.) or new characteristic values can be formed. The result can be visualized directly in TrendViewer and further processed.
Switching Units With a Click
IFTA TrendViewer Highlight 12
- TrendViewer supports the conversion between unit systems
- Within a plot or an axis, It is possible to switch between the international SI-system of units, the US-system or even an own defined system with one click only

