The right selection of high temperature sensors.
Avoiding Damage in Combustion Chambers
Why Continuous monitoring of Vibrations is necessary
Combustion dynamics can cause expensive damage to gas turbines and other combustion systems. These mostly thermoacoustic forms of vibration are particularly dangerous because, on the one hand, within a very short time they can reach an amplitude that is harmful to the machine. On the other hand, their occurrence depends significantly on influencing factors that are difficult to quantify or that change continuously, such as the environmental conditions at the machine location (e.g. humidity or temperature), the current machine condition, the manufacturing tolerances of the specific machine, the fuel composition on site, and so on.
In short, combustion oscillations cannot be predicted reliably due to the large number of influencing factors. Therefore, they must be constantly monitored, especially in critical applications such as power plants for electricity production or compressor stations for pipelines. The erratic occurrence of these vibrations also requires continuous recording of all measurement data, as this is the only way to ensure data availability for analyses in case of damage.
THE IFTA solution for Monitoring and protection
The IFTA ArgusOMDS monitoring and protection system has been specifically designed to monitor and diagnose combustors in gas turbines and has been proven in hundreds gas turbine power plants worldwide. The system can be tailored to specific requirements thanks to our modular hardware and software concept, so that an optimal solution can be found for every application.
practical knowledge around thermoacoustics
If you have questions about combustion dynamics, you are at the right place - because IFTA is an expert in the field of thermoacoustics. Both due to many years of practical consulting of customers - especially in the field of gas turbines - and due to our research projects.
Real-time protection for combustion chambers with comprehensive recording and analysis tools:
- Detect and record combustion dynamics 24/7
- Real-time protection and vibration diagnosis
- Extensive analysis with the IFTA TrendViewer evaluation software
- Optional software module IFTA PreCursor for early detection of vibrations in annular combustion chambers
Our product recommendation is the monitoring and protection system IFTA ArgusOMDS with the software equipment TrendViewer Expert C for combustion dynamics.
Challenges When Monitoring Combustion Chambers
Sensor SELECTION
Due to the extreme conditions in a combustion chamber - high temperature and high pressure - only special and expensive high temperature sensors without integrated electronics can be used directly on or close to the combustion chamber. If inexpensive low-temperature sensors are to be used, they must be placed away from the combustion chamber - but this is accompanied by a number of disadvantages.
Position OF THE Sensor
Sensor positions should be chosen carefully to ensure that all critical modes that may occur can also be measured reliably. If the sensor position is in the oscillating node, this cannot be detected at all or only very inaccurately. More than one sensor is the method of choice here, but economic aspects such as cost of acquisition and maintenance often speak against this.
Real-time analysis of measurement data
In order to extract the information necessary for machine protection from the raw measurement data, it must be processed and evaluated in real-time. The mathematical models necessary for this require a profound understanding of the physical phenomena as well as significant computing capacities in the field.
Signal analysis
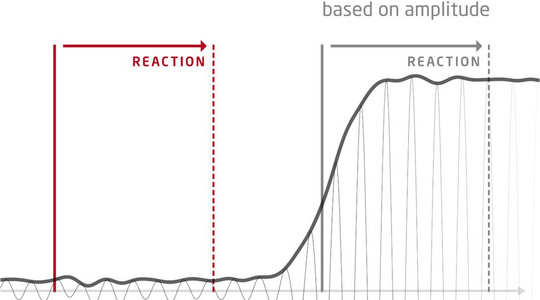
The decisive factor here is the frequency up to which oscillations can occur. Small combustion chambers require sampling rates up to 50 kHz and more. In addition, oscillations usually occur spontaneously and rapidly. This makes a seamless and continuous analysis with overlapping FFT windows indispensable. This is the only way to detect, in particular, rapidly rising and declining oscillations.
Reliable protection of the monitored combustion chamber
To ensure this, a stable 24/7 real-time analysis with the lowest possible latency is necessary, which requires appropriate input cards, processors (DSPs) and output cards. Thus, PC-based solutions are not appropriate. Only this ensures reliable protection and prevents damage.
Efficient processing of big data
The demand to record measurement and operational data with high sampling rates and a large number of sensors 24/7 quickly leads to a very large amount of data. This must be collected and pre-processed in real-time in order to store and analyze it efficiently afterwards - e.g. with the help of machine learning methods.
Benefit From Our Know-How
We are the only company in the world specializing in thermoacoustic oscillations in combustion chambers. Since 1996, we have been supporting our customers with our expertise and our proven protection and monitoring systems. Our goal is to provide compatible solutions for the entire product life cycle: From early testing, to broad field application, to service and product optimization.
The latest Technology for your test bed
In the early development phase of a machine, it is important to learn about it as quickly as possible. Only this way its minor bugs can be solved and efficient and effective operation strategies can be worked out. One key to optimization is the recording and analysis of long-term measurement data: The more high-quality data is available and the more efficiently it can be analyzed together, the more successfully you can optimize machines and processes.
IFTA systems offer the latest available technology:
- Robust and continuous 24/7 storage of all measurement and operating data in a format optimized for efficient further processing - e.g. with machine learning algorithms.
- Real-time capable, high-performance hardware to evaluate signals close to the machine - the so-called edge - e.g. to enable model-based protection or to reduce the amount of data transmitted.
- Intuitive and fast user software that can visualize and analyze large amounts of data, both online and offline.
- Input modules for all common measurement parameters: From analog voltage or current signals to temperature sensors and strain gauges to torsional vibrations.
- Flexible integration of operating data, e.g. via OPC, Profibus/Profinet or as analog signals.
- Numerous possibilities for controller communication, e.g. with analog signals, relays or Profibus/Profinet.


FROM the test bed into the field
While the goal at the test bench is to collect as much data as possible, the aim in the field is to minimize instrumentation and data processing. This is the only way to establish an economically successful fleet. The compatibility and modularity of our hardware and software products enables exactly this: Transfer the knowledge gained on the test bench directly into the field and invest only in components that really contribute to a measurable benefit.
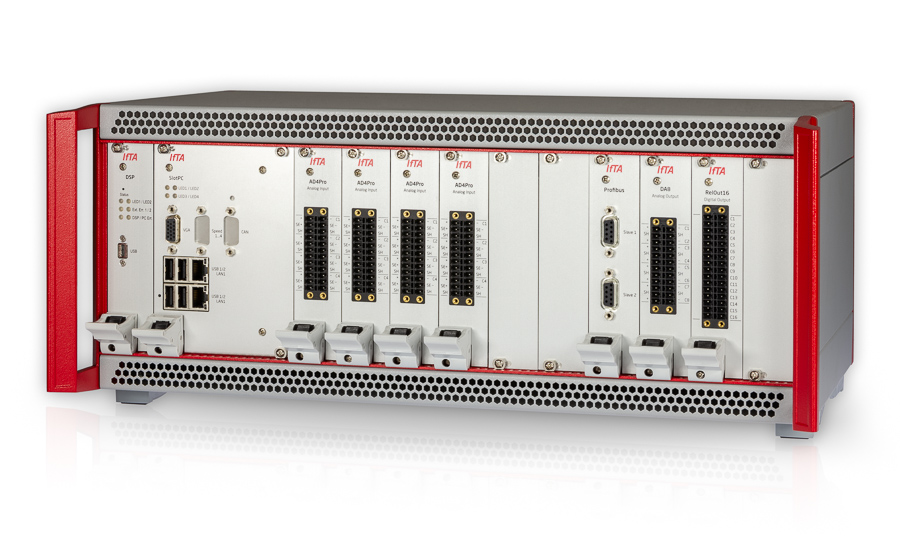
If unforeseen problems should occur and e.g. temporary data recording should be required, IFTA systems offer all options: Simply plug our ready-made SlotPC with DataHub into the system and all data will be automatically recorded immediately. This gives you access to data that cannot be measured on the test bench - for example, because many events occur randomly, depend on local conditions, or their consequences are not acceptable for the machine.
Highest plant availability and efficiency
Robustness and quality are the top priorities for all our products, because we know what matters most to our customers: Highest plant availability and safety. In second place comes the most modern technology, which makes it possible to operate your plants at maximum efficiency.
Our primary goal is therefore to ensure that our products run 24/7 for many years, maintenance-free and without failures. Thus, for example, we rely on passively cooled hardware, since experience has shown that fans can fail. Our systems also restart after a power failure and continue their work automatically - including data recording. The IFTA systems' design follow an onion-skin principle: users only interact with the outermost layer. Data recording occurs one layer below, and all real-time functions necessary for machine protection run in the core. Together with a granular access control of the individual components, this ensures highest IT security and robustness of the most important system functions.
Combustion Monitoring and Protection
The ArgusOMDS has been developed and proven over more than 20 years in the monitoring of combustion dynamics, such as those occurring in gas turbine combustors. Numerous Siemens Energy gas turbines, e.g. of type 4000F and 8000H, are equipped with the ArgusOMDS protection system and ensure reliable power supply on a daily basis.
The advantages of the ArgusOMDS system:
- Real-time reaction to oscillation events via output cards for protection functions
- Highly customizable long-term data recording over months including seamless raw signals and compact overview files
- Recording of operational data to understand under which conditions vibrations occur
- Customizable pre/post triggers for additional event storage
- Modular construction for flexibility in the choice of Input modules
- Integrates SignalMiner and DataHub software to record, store and redistribute data
- Real-time protection and control functions via a choice of output modules
- Integrates IFTA TrendViewer data analysis software to visualize, explore and analyze the recorded data
- Optionally with thermoacoustic early warning system IFTA PreCursor
Reduction to Machine Protection
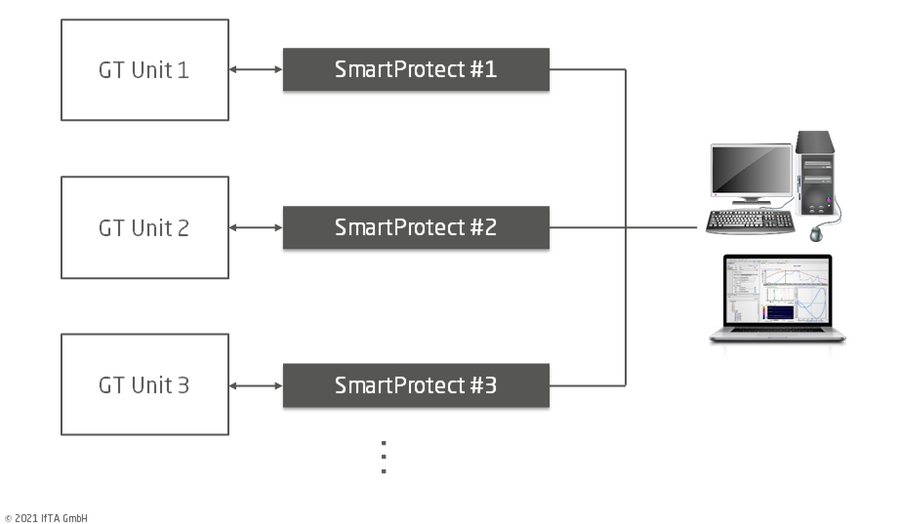
The IFTA SmartProtect system focuses on pure machine protection, without the data recording and diagnostics of the IFTA ArgusOMDS system. It is therefore ideal for cost-effective plant protection where extensive data analysis and long-term data recording are not required.
As shown in the illustration below, multiple SmartProtect systems can be connected to a central workstation for data recording and analysis.This reduces hardware requirements compared to using multiple ArgusOMDS systems and pools data streams from multiple gas turbine units. Either all systems can be connected at the same time in this way, or - e.g. via laptop - one system can be connected after the other. The latter concept makes it possible to use the data recording and analysis temporarily as needed, for example for problem analysis or tuning. In any case, protection is continuously active for each turbine unit.
- Modular setup for flexibility in the choice of input modules
- Real-time protection and control functions via a choice of output modules
- Optional with thermo-acoustic early warning system IFTA PreCursor
- Upgradeable with analysis and recording function for short- or long-term use
Vizualization of Combustion Dynamics with IFTA TrendViewer
With the help of the IFTA system ArgusOMDS, it is possible to record the machine-dynamic operating behavior of gas turbines, steam turbines, generators or even drive trains. The analysis software IFTA TrendViewer offers specialized plots to display complex relationships in a clear and flexible way.
Plot representations for visualization of dynamic signals
Waveform Trend Plot
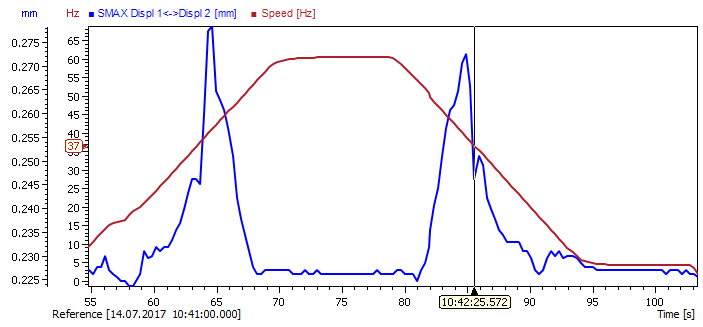
Waveform Trend Plot
Use the Trend plot to analyze value changes over time. The time is plotted on the x-axis and the values are plotted on the y-axis.
Analyze waveforms to see how the amplitudes and waveforms change over time.
The example shows a distance sensor signal from a rotating machine. On the x-axis the time is drawn, on the y-axis the magnitude of the signal is plotted.

Spectrogram Plot
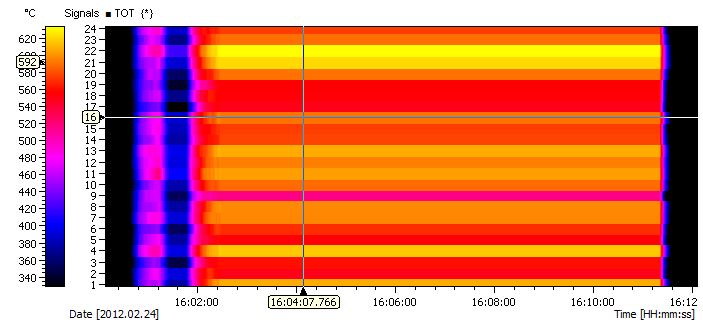
Spectrogram Plot
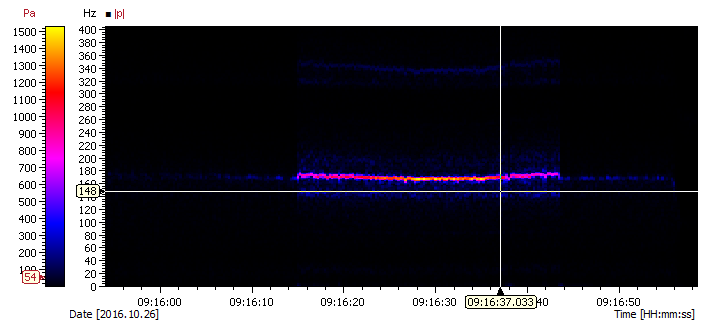
Analyze frequency phenomena over time with a spectrogram. Display amplitude changes for all frequency lines at once.
In the example the absolute spectrum of a pressure sensor installed in an acoustically excited burner is displayed. You can see how the amplitude of the first harmonic at a frequency of ≈175Hz and increases and decreases over time.
On the x-axis the time is displayed, on the y-axes the spectrum unit, e.g. frequency [Hz]. The color bar on the left defines the colors depicting the magnitude of the spectrum values.
Spectrum Plot
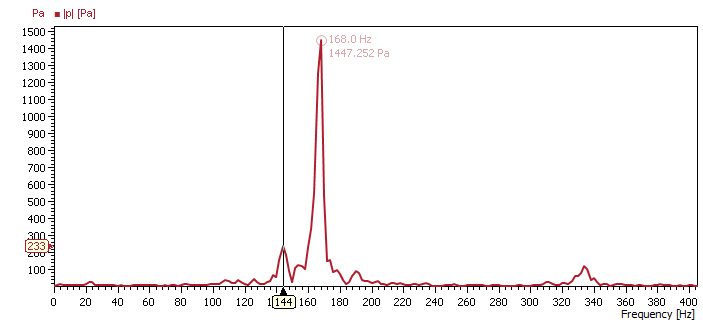
Spectrum Plot
Use the spectrum plot to analyze spectra for a selected point in time. Read the amplitude for all frequency lines at once and identify relevant frequencies at current time cursor position.
The figure shows the absolute spectrum of a pressure sensor installed in an acoustically excited burner. The resonance peak at 168 Hz is automatically marked with a label depicting the magnitude and frequency.
The plot is often used in conjunction with an intensity plot to display the values at the current cursor point. On the x-axis, the frequency is displayed and on the y-axis the magnitude of the spectrum.
Plot representations for visualization of static vibrations
Trend Plot
Trend Plot
Use the trend plot to analyze value changes over time. The time is plotted on the x-axis and the values are plotted on the y-axis.
Visualize how a signal changes over time in trend plots. Find dependencies in your data by adding multiple signals to the plot.
Boolean Trend Plot
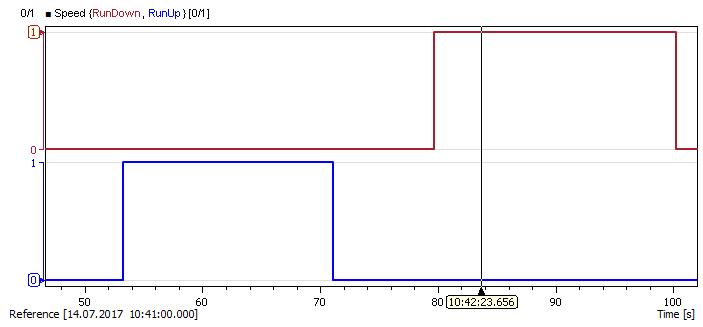
Boolean Trend Plot
Use the Trend plot to analyze value changes over time. The time is plotted on the x-axis and the values are plotted on the y-axis.
Analyze boolean/logic signals over time and identify points in time at which changes take place. Signals are automatically stacked and grouped to one y-axis for better readability.
In the example run-up and run-down signals of a rotating machine are displayed. On the x-axis time is shown and on the y-axis the state (0 for false and 1 for true). As you can see first the machine is in run up state and after a short amount of time it is run down.
Intensity Plot
Intensity Plot
Display a group of signals with the same unit in one intensity plot. You get an overview of the values over time. Thus, you can quickly identify sensor values which deviate from the rest of the group and analyze how values change over time. The plot gives a quick condensed overview over a group of signals which is superior in comparison to a trend plot.
In the example, 24 turbine outlet temperatures are drawn on the y-axis over the x-axis (time). The temperature is drawn by color, where the color corresponds to a value displayed on the "color bar" on the left side of the plot.
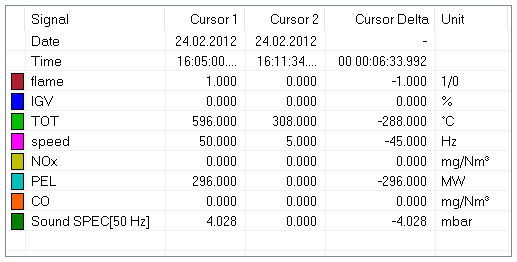
List Plot
List Plot
Display the values of signals at the current time cursor positions. Thus, you can quickly compare values of different signals and different times.
In the example, the current values of machine state variables are shown for time cursor 1 and 2. Additional data is the time, the value difference between the two cursors and the signal unit. It is possible to configure the number of tables, visible columns and rows.
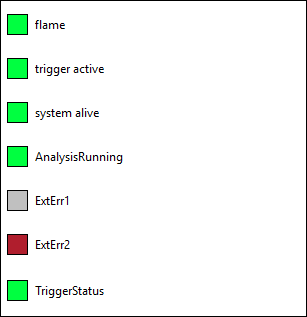
LED Plot
LED Plot
The LED Plot displays states (boolean/logical signals) at the current time cursor position. See immediately if an error or alarm occurs and if your system is running correctly.
The example shows several binary signals (green/red for true and grey for false). A color can be chosen for the active and inactive state.
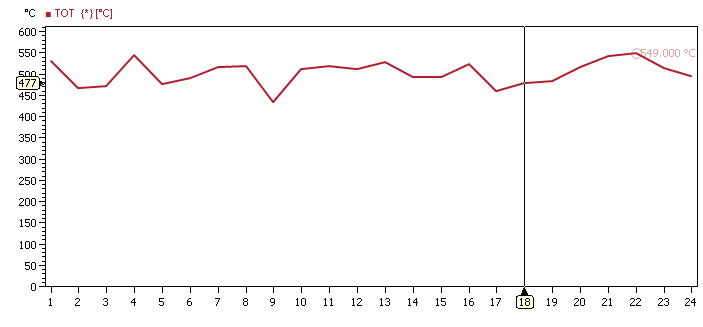
Array Plot
Array Plot
Display a group of signals with the same unit in one plot. You get an overview of the values at the current time cursor position. Thus, you can quickly identify sensor values which deviate from the rest of the group.
In the example figure you can see 24 turbine outlet temperatures. On the x-axis, the sensor number is displayed and on the y-axis the temperature.
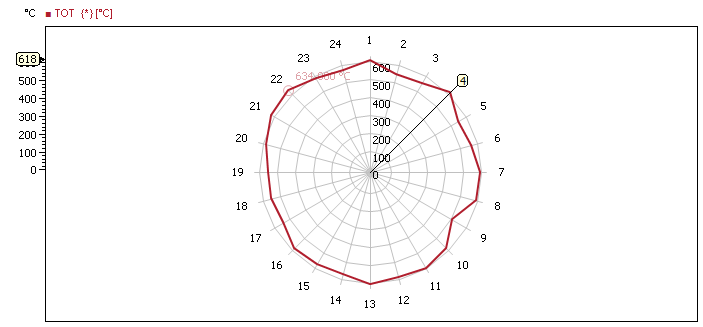
Radar Plot
Radar Plot
Use the Radar plot to gain a quick overview over multiple signals at once. You can easily see if one sensor provides different data than other sensors for a larger number of measurement signals.
In the example you can see 24 turbine outlet temperatures drawn equidistantly around the plot origin.
High Temperature Sensors Versus Infinity Tubes
Ideally, pressure oscillations should be measured at the point where they have the greatest influence on the machine behavior or condition. If the pressure oscillations are caused by thermoacoustic combustion instabilities, this is directly at the combustion chamber. Since conventional pressure sensors cannot withstand the very high temperatures prevailing there, there are essentially two approaches:
- Positioning the sensor at a sufficiently cool location. The pressure oscillations are "conducted" from the combustion chamber to the sensor position with the aid of a tube or hose
- Use of special high-temperature pressure sensors
Infinity Tubes
The first option makes it possible to use conventional pressure sensors. The disadvantage of this solution is that the pressure is not measured directly in the combustion chamber, but in a tube attached to it. Each tube has a number of natural frequencies depending on its length. The pressure amplitude measured in the tube thus depends on the respective oscillation frequency as well as the positioning of the sensor. Only for small frequency ranges the amplitude measured in the tube can be simply compared to the actual amplitude prevailing in the combustion chamber. This problem is often solved by making the tube very long in order to minimize resonance peaks for relevant frequency ranges at the sensor position - in this context, one therefore often speaks of so-called "infinity tubes". These infinity tubes have the disadvantage that they are quite bulky. On the other hand, they are susceptible to damage. For example, deformation or condensed water can cause unwanted cross-sectional narrowing, which in turn leads to reflections and thus limited functionality.
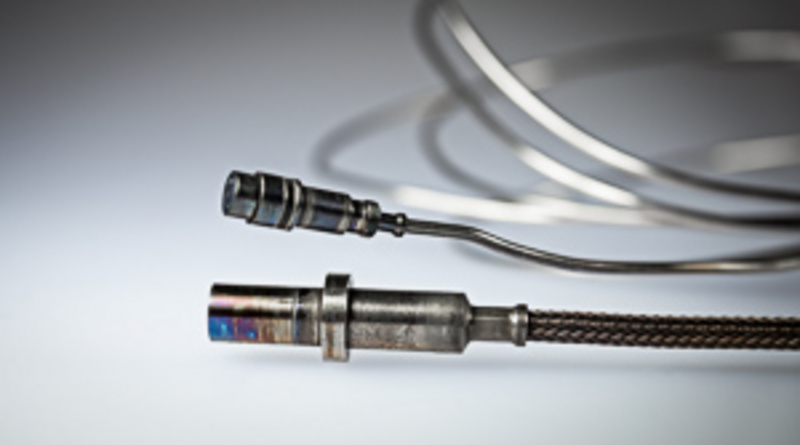
High Temperature Sensors
The much more robust solution are high-temperature sensors, which can be mounted directly at the combustion chamber. Due to the harsh environmental conditions prevailing there, the charge amplifiers normally integrated in the sensor have to be relocated. These external charge amplifiers are connected to the sensors using temperature-resistant cables, resulting in a more complex measurement setup. However, a measurement chain of this type allows acoustic pressure fluctuations to be measured directly in or at the combustion chamber over a very wide frequency range with virtually no falsification.
Conclusion
Two solutions exist for measuring pressure oscillations in combustion chambers: (1) The use of high-temperature measurement chains and (2) the use of so-called infinity tubes. Technically, the first solution is superior in every respect. Only the lower price and a larger range of sensors on the market speak for the use of Infinity Tubes.
Advantages of the IFTA Solution in Case of Combustion Dynamics
Flexibility & Compatibility
Modular hardware offers simple flexible design and compatibility with common sensor principles. Sensors are suitable for high temperature environments. A wide selection of input modules and a lean measurement chain for low-noise signal transmission complete the selection.
Reliable protection
The monitoring and protection system IFTA ArgusOMDS provides long-term recording, triggered data storage with pre- and post-trigger, and protective shutdowns for machine and plant safety.
Real-time data analysis
The IFTA DSP with its SignalMiner firmware provides real-time measurement and analysis and comparison of machine and operating data. With the evaluation software IFTA TrendViewer, measurement data is analyzed online and, if necessary, settings for efficient and reliable machine utilization can be optimized directly.
Plant availability & safety
The monitoring system IFTA ArgusOMDS monitors plants autonomously and reliably 24/7, even over years. Data is reliably recorded and can be analyzed if required.