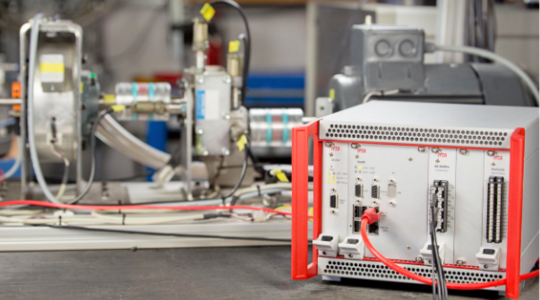
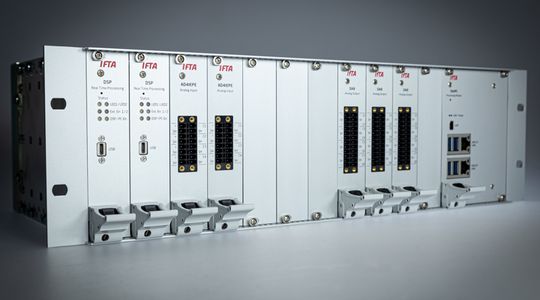
The proven monitoring & protection system for stationary long-term use.
The Center for Dynamic Data
Storage and distribution of data via IFTA DataHub
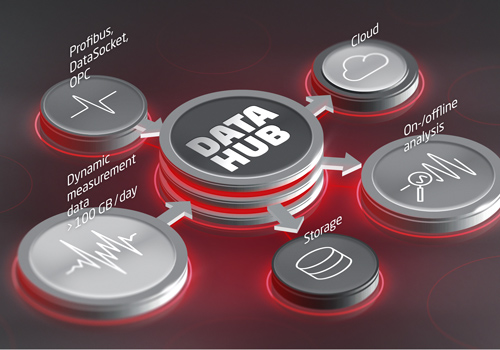
The IFTA DataHub software collects all data on a Windows based PC to archive, store and distribute it online in a network for visualization purposes. The sources of the data is not only the IFTA SignalMiner with dynamic data, but also data from OPC, DataSocket or other proprietary interfaces that record the operating conditions of the machine or environmental influences. Merging all these data allows the dynamic data to be viewed in a context. In addition, compact overview files are created by merging data chronologically and logically. Thus, it is possible to provide a daily overview of the machine behavior, which requires only a few MB of data and is also easily retrievable by remote access. The functions of storage, triggering, filtering and summary can be freely parametrized.
Long-term Analysis of Dynamic Measurement and Operating Data
Finding the needle in a haystack
The new DataHub software collects data from a wide range of sources and enables combined analysis. For example, dynamic measurement data of more than 100 GB/day from IFTA measurement systems can be analyzed together with operating data. This data is stored 24/7 in ring buffers. The search for relevant events in these large amounts of data corresponds to the literal search for the "needle in a haystack".
Here, the DataHub supports the user by creating small, easy to handle overview files that allow a quick check and finding anomalies. In addition, the provided online connection allows real-time inspection of all data streams and data streaming into the cloud.
Data Aggregation for Efficient Analysis of Large Data Sets
Dynamic Vibration Measurements Generate large amounts of data
Digital recording of dynamic vibration data generates large amounts of data very quickly. For example, acquisition of vibrations up to 5 kHz requires a data rate of at least 10 000 samples per second (S/s). Assuming that each single sample requires 4 bytes of memory, this results in a data rate of 40 kByte/s, which are 144 MByte per hour or almost 3,5 GB per day. Since usually more than one sensor is used, monitoring a complete machine generates a much larger amount of data than this.
How does data aggregation work?
This flood of data brings along a variety of challenges. Many of them can be addressed with a technique called data aggregation. Here, a "data condensate" is produced from raw data in real-time which needs significantly less storage space and yet contains all essential information. This condensate allows quick insights into large data sets and serves as a guide and indicator during analysis.
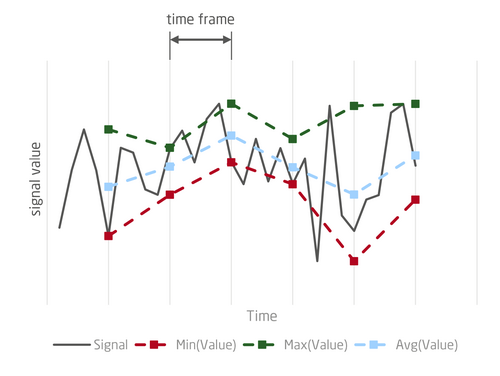
The IFTA DataHub supports aggregation over time, which is illustrated in Figure 1. For a given series of subsequent time frames, a high-resolution signal is aggregated to three data points per time frame: The first point equals the minimum value of the signal within a time frame, the second the maximum, and the third the average value. Accordingly, three new low-resolution signals are generated, which characterize the initial signal. Their time resolution - and hence their memory requirements - depends on the selected window width, which is chosen by the user.
Benefits OF TIME AGGREGATION
Temporal aggregation of data allows the efficient analysis of large time periods. Figure 2 illustrates this advantage. The left side of the figure shows spectrograms of 100 MByte of sensor data for two aggregation levels including raw data. Whereas without aggregation only a very short time period is covered (bottom), the highest aggregation level (60 s) provides an overview of a very wide time range. If an event is detected here, it can be zoomed into the data by successively loading the next finer aggregation level (5 s or raw data). The right side of the figure illustrates this for the time domain accordingly. In doing so, the data to be processed and thus the required memory and computing resources are minimized, which enables effective working even for large data sets.

Benefits at a glance
- Fast visualization and analysis of large time periods
- Pinpoint accurate zooming into raw data
- Aggregated data is available immediately as data aggregation is performed continously during data recording
Overview Functions of the IFTA Software DataHub
Basic Structure of the IFTA DataHub Software
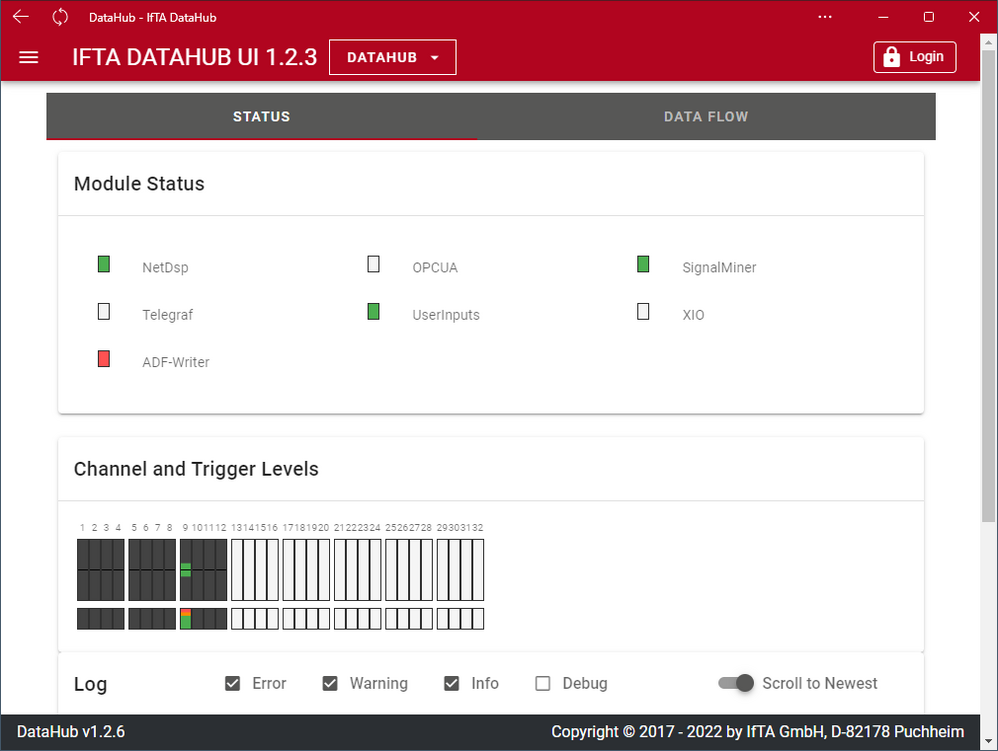
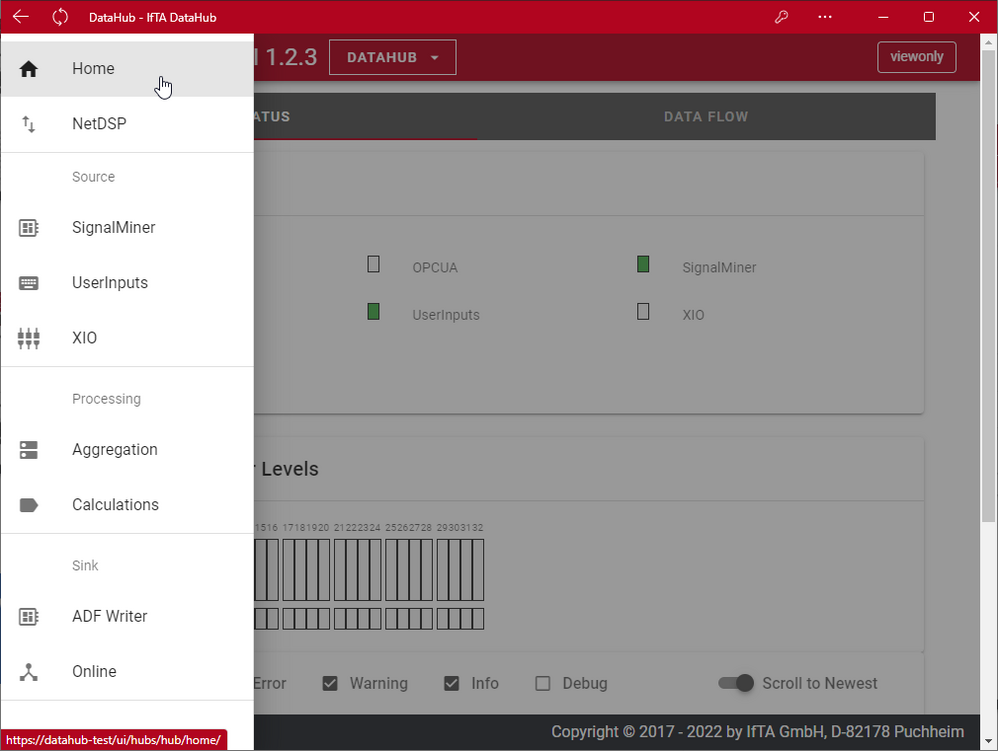
The IFTA DataHub software consists of two components: a background service that handles the actual tasks and a web-based interface for users. Thanks to this separation highest reliability and robustness is given.
- The backround service collects data from all sources and bundles, filters, aggregates and packs them into files for life visualization and analysis in the IFTA TrendViewer software
- The web-based interface allows users to comfortably configure, check status and interact via browser, on the IFTA system as well as remotely from their own laptop
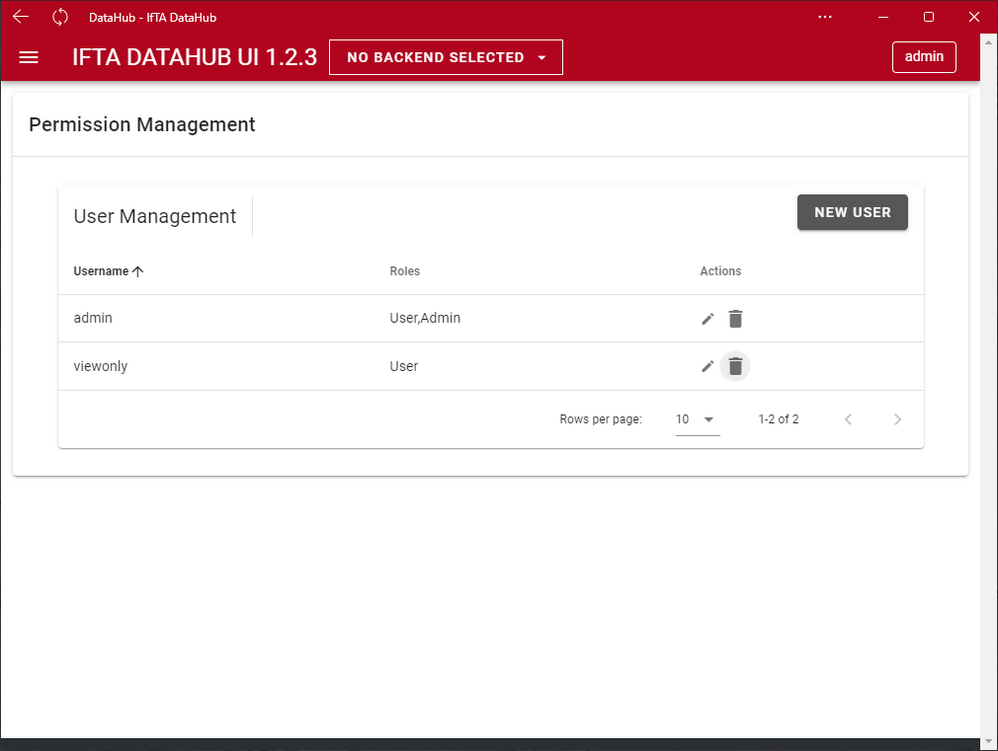
- A user management can be used to determine who can carry out which actions
Collecting and Bundling of Measurement Data
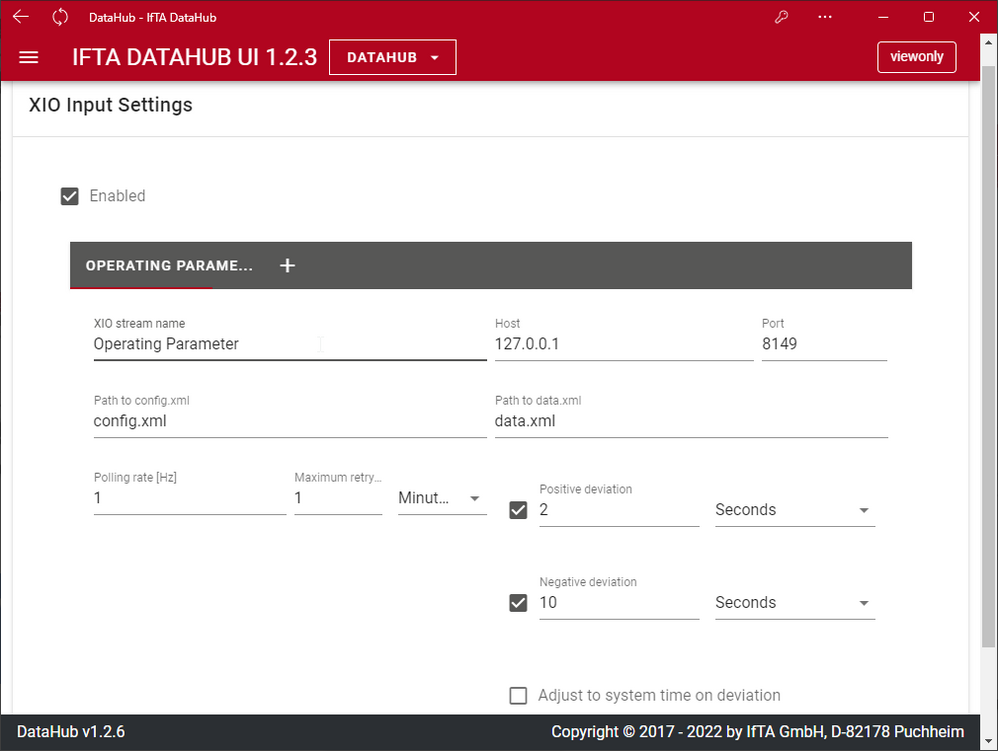
In the settings of the data sources it is configured from where the DataHub should collect data. The IFTA SignalMiner firmware on the IFTA DSP is the main source for measurement data - here any dynamic data are acquired.
In addition to dynamic data typically further measurement values are required (operating data, environmental conditions, etc.), which can be acquired over the following interfaces:
- DataSocket
- OPC DA
- OPC UA
- Profibus via SignalMiner
- Profinet via SignalMiner
Upon request proprietary interfaces can be connected.
Bundling, Filtering and Triggering Measurement Data Over Time
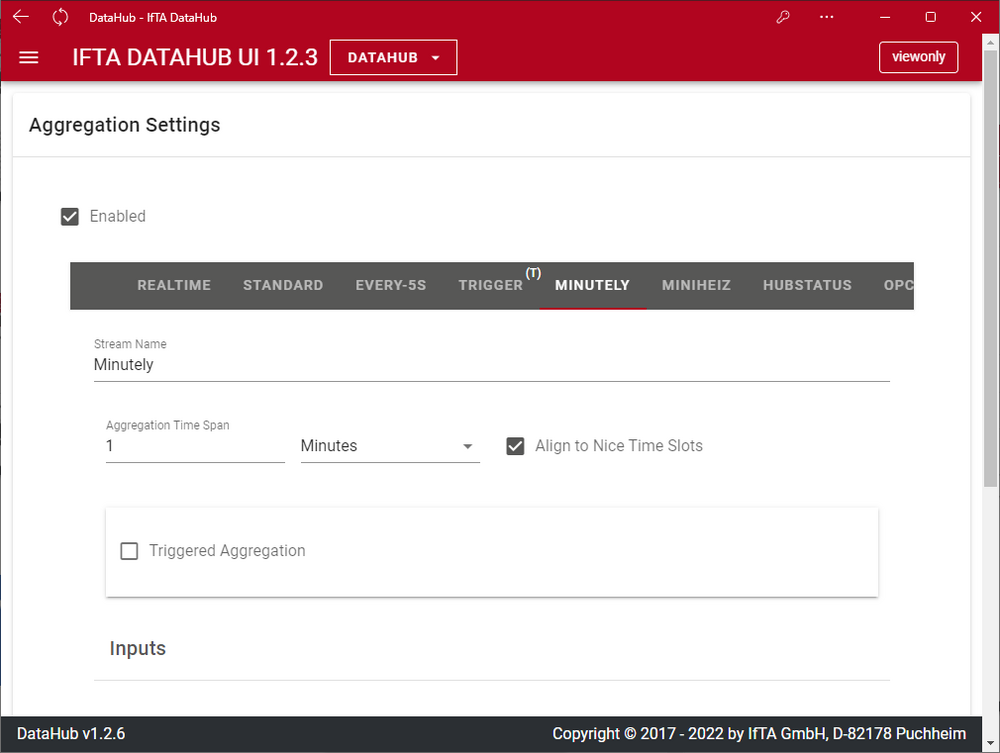
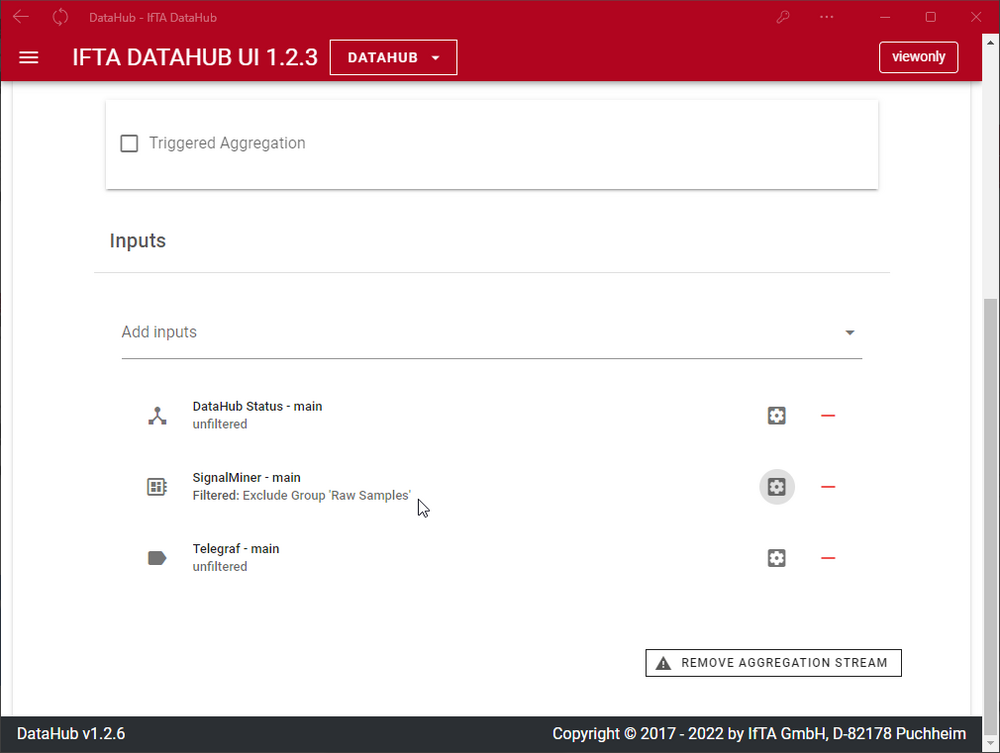
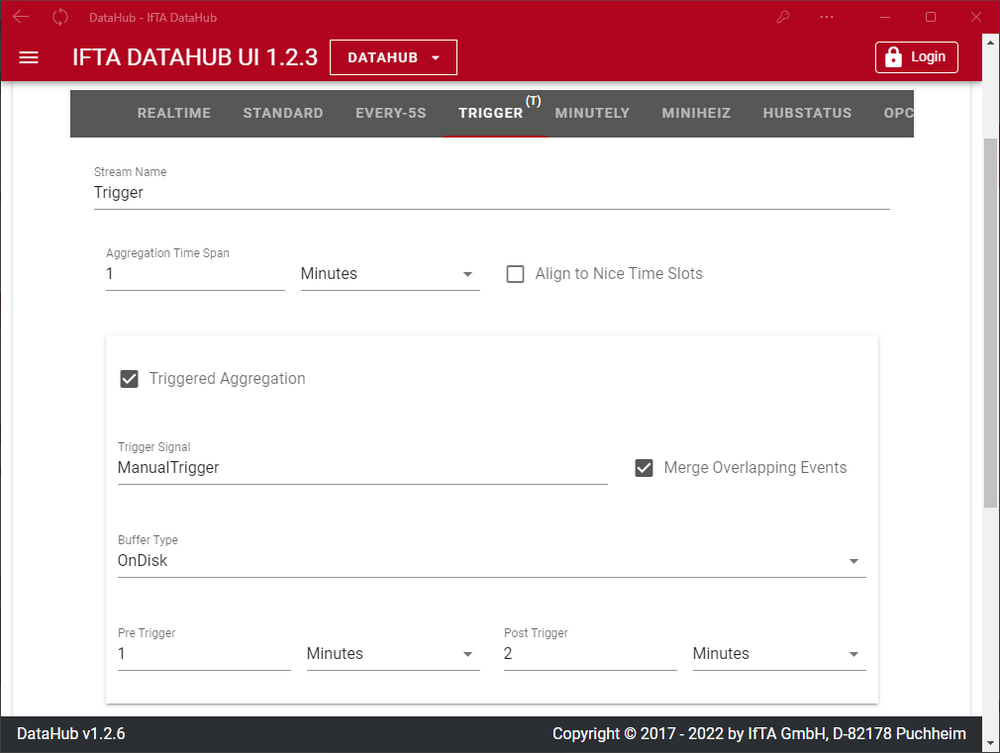
The "Aggregation Settings" bundle configured data sources into new data streams.
Adjustable functions:
- Which sources of data streams should be bundled
- Which sources of data streams should be filtered, as only relevant signals should be selected in order to reduce the amount of data
- Set time aggregation in order to reduce the data rate and hence the amount of data
- Configure triggers with a pre- and post-trigger time span
Recording Measurement Data for the Offline Analysis
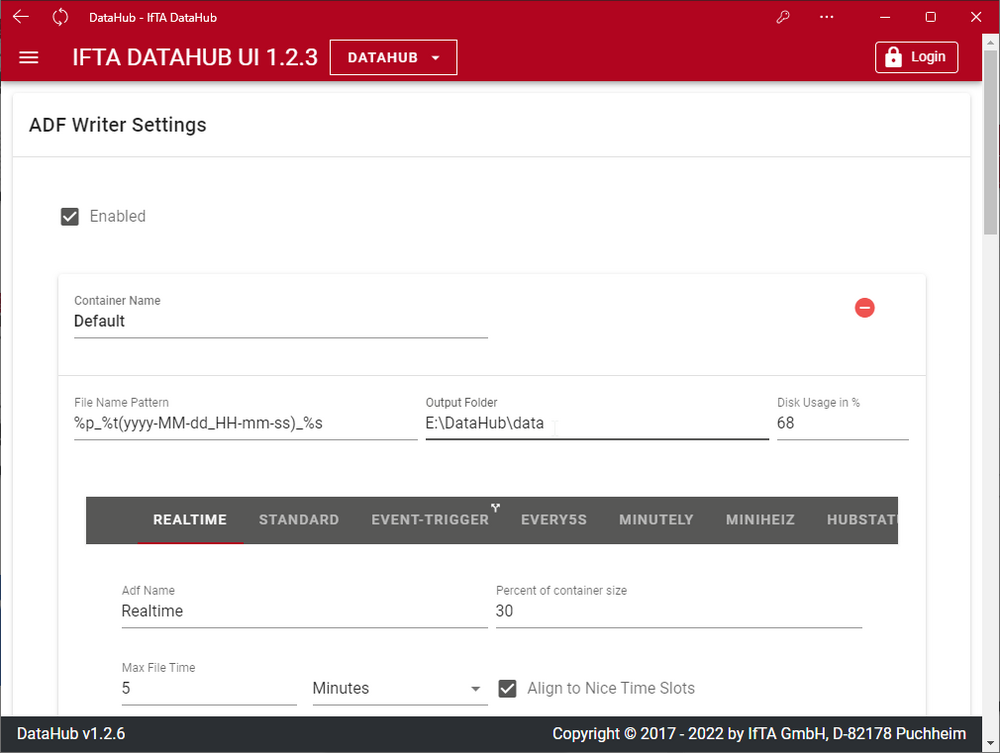
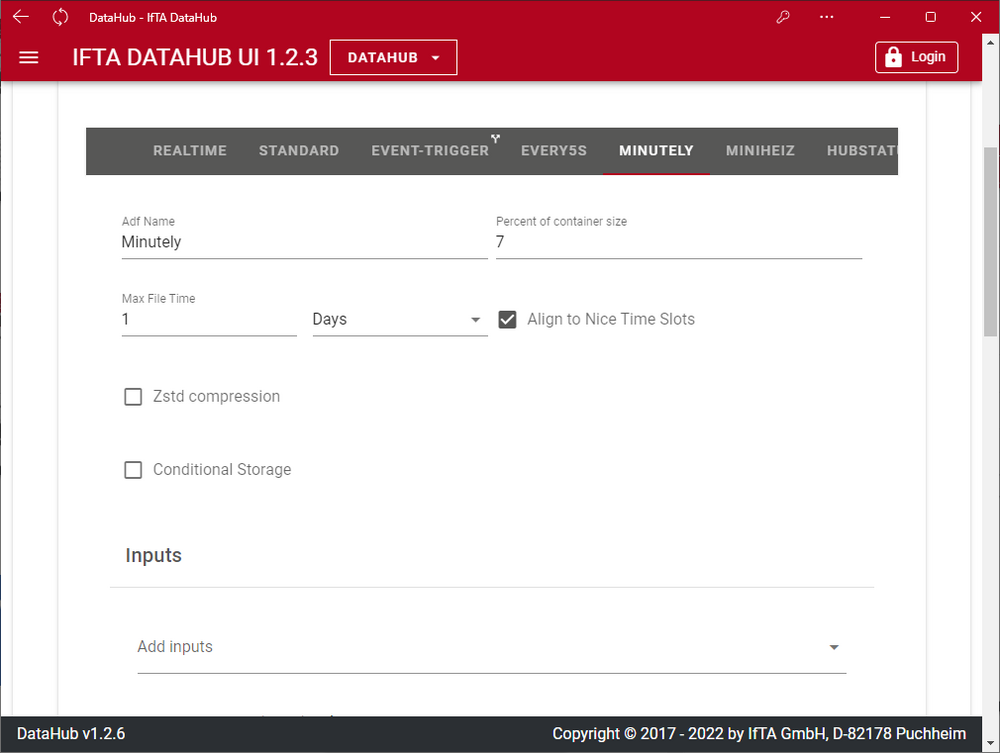
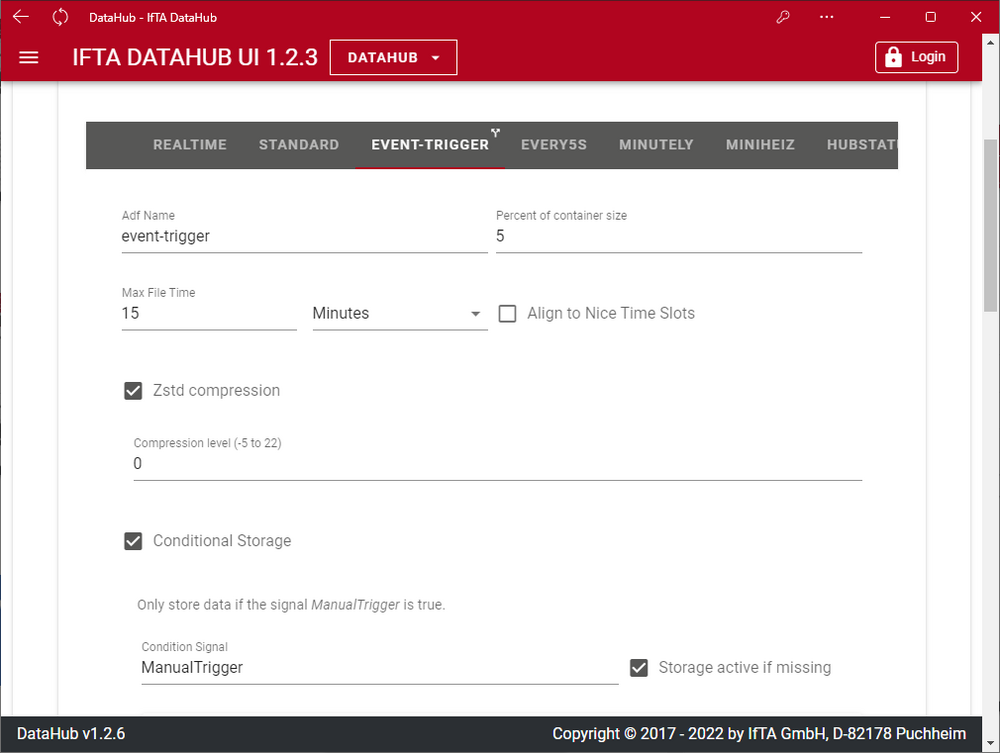
In the "ADF Writer Settings" saving of measurement values in files can be configured so that they can be used for the offline analysis later, for example, in the analysis software IFTA TrendViewer. In order to prevent the storage medium from overflowing, the oldest files are deleted when the configured storage capacity has been reached in order to make room for new current files.
Adjustable functions:
- Definition of the storage location and the ring buffer storage location to be used
- Definition of the file name format
- Recording of data streams according to time slices
- Defintion of the data streams to be saved
Providing Measurement Data for Online Visualization
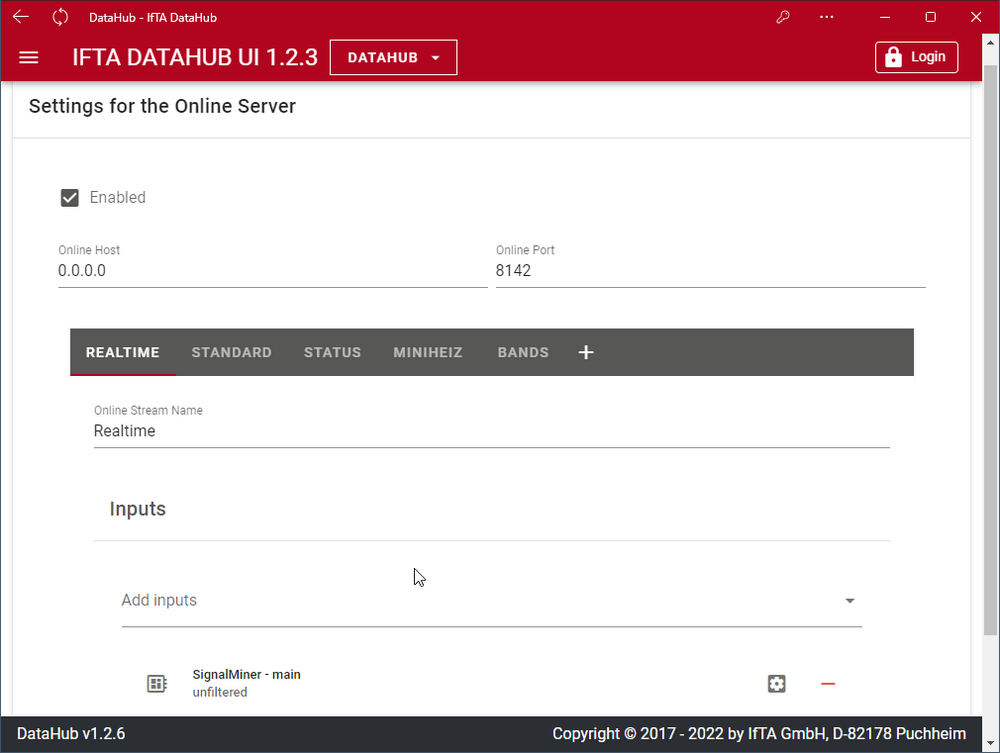
In the "Settings for the Online Server" one configures the streaming of the measurement data to online clients such as the analysis software IFTA TrendViewer. For continuous monitoring by users or when performing specific measurements, the user can use this to visualize and analyze the measurement data live, e.g. using TrendViewer.
Defining Signals by Calculations
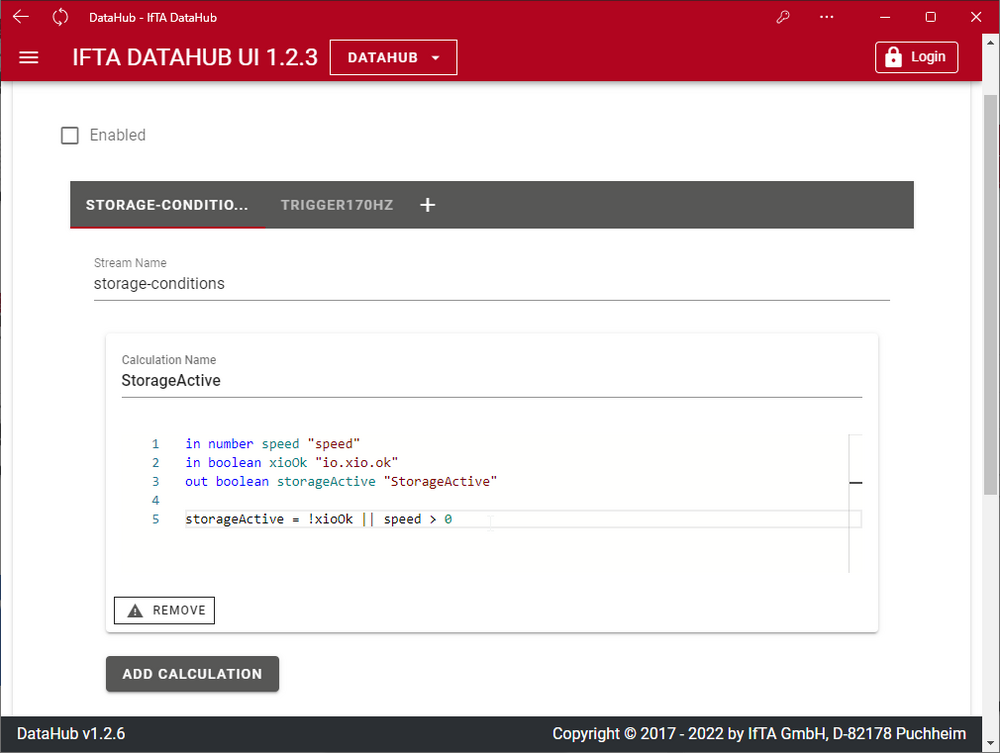
In the "Calculations Settings" signals derived from existing data sources by calculations can be generated.
The main applications for this are:
- User defined trigger conditions
- User defined storage conditions
Providing User Input as Signal
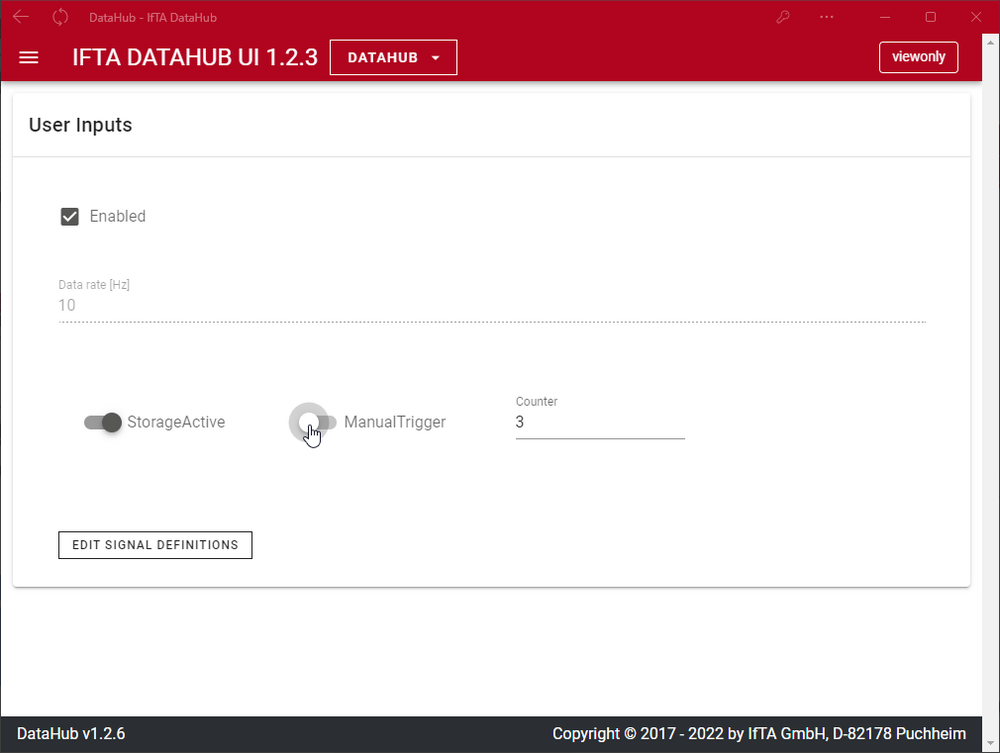
In the "User Input Settings" further signals can be defined as data source directly by user input. After definition of the signal the user can set values directly that are then saved along with measurement data or the user can control other actions such as recording and triggering.
The main applications for this are:
- Manual control of recording
- Manual activation of a trigger
- Manual acquisition of further information that is not available over a sensor or other data source e.g. measurement point number, environmental conditions, states
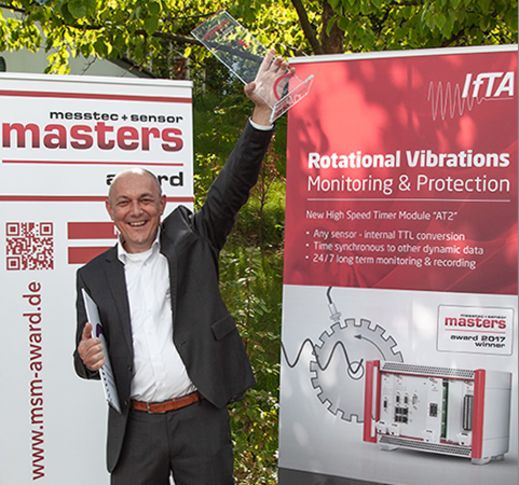
1st Place for the IFTA DataHub
Presentation of the messtec + sensor masters award 2020
The IFTA DataHub software was awarded 1st place winner of the messtec + sensor masters award 2020 on September 22, 2020.
Dr. Jakob Hermann, General Manager at IFTA, is particularly pleased about this award: "The DataHub software is the heart of our vibration measurement systems. It collects dynamic measurement and operating data from various sources and provides smart 24/7 long-term storage for later analysis. In 2016, our analysis and visualization software TrendViewer was also awarded first place. Together, they are a powerful software package for the efficient root cause analysis of vibrations in machines and plants that has been "awarded" by the readers of MD-Automation.“

The Next Step: Data Analysis with IFTA TrendViewer
Once data has been collected and aggregated via the DataHub software, analysis and evaluation of the data can be done with the IFTA TrendViewer software. In this way, for example, errors can be found, data can be compared, and optimization decisions can be made.
The better you know your machines, the more optimizations are possible.

