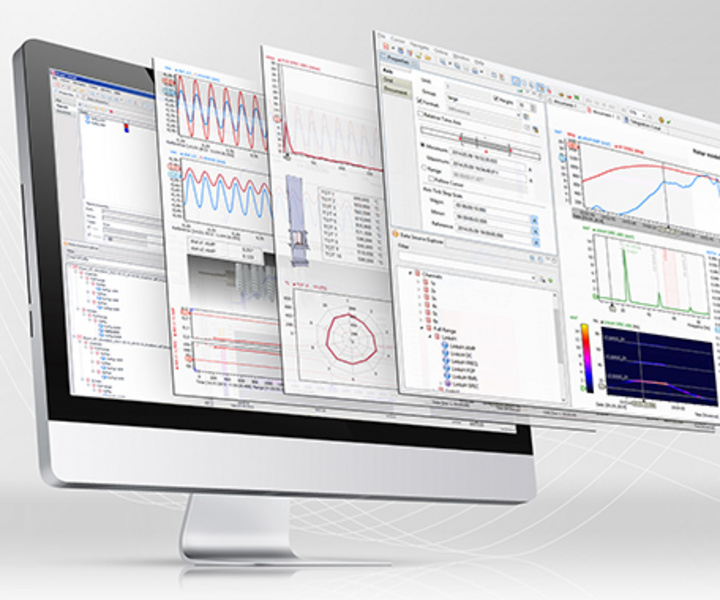
The proven data analysis software IFTA TrendViewer for the efficient analysis of big vibration measurement data gathered from machines and plants, is released in the new version 5.4. Here is a brief overview about the highlights of the new version:
NEW RotorDynamics Features:
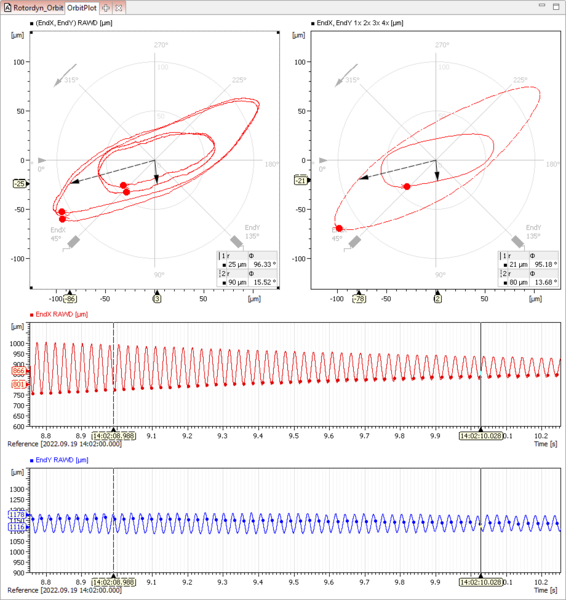
Display of different harmonics of the rotational speed with superposition in the Orbit plot
Better overview: Trigger events are plotted directly in the Orbit and Trend plot
No need to repeat the time range when changing the rotation frequency: Instead of defining a fixed time range, the data range can now be plotted based on the number of trigger events (e.g. rotations)
Consistent machine coordinate system for Orbit, Shaft Centerline and Polar plots
ShaftTwist Calculation for calculating the torsional angle of a shaft between two trigger sensors
Simplified handling:
- Improved dialogue for color selection of signals, gridlines and frequency bands as well as their limit value alarms
- Traceable and adjustable measurements: SignalMiner configuration can be extracted from ADF and online data
Performance improvements:
- Improved memory consumption and speed of ADF file loading
Thus, TrendViewer's familiar intuitive operation has been improved further.